Technical analysis is a method or collection of techniques used to study and analyze the past data of financial assets, such as stocks and currencies, to forecast future price movements or directions using statistics. It is a subset of security analysis and stands in contrast to fundamental analysis.
Unlike fundamental analysis, technical analysis does not depend on a company’s financial statements, management, or business strategies. Instead, it relies on statistics and mathematics. In technical analysis, "what" is more important than "why." According to Modern Trader research, there are approximately 13.9 million traders in the world.
Components of Technical Analysis
Candlesticks
There are a number of chart types, such as line and bar charts. Similarly, a candlestick chart consists of candlesticks that show the high, low, opening, and closing market prices of a financial asset—such as a stock, currency, or derivative—within a specific time interval.
Traders primarily use candlestick charts compared to other chart types because they help traders visualize price movements more effectively.

Basic Chart Patterns
Markets display different types of chart patterns, where a pattern represents the shape of a security's price movement. There are various patterns, such as double tops, double bottoms, triangles (ascending, descending, and symmetrical), head and shoulders, rising and falling wedges, bullish and bearish pennants, and rectangles. These are fundamental components of technical analysis used to identify trends and market sentiment; they help traders determine which indicators, time intervals, and strategies to employ.
Indicators
Indicators play a vital role in estimating future target prices or directions for short time intervals by analyzing past price movements. They can be classified into two types: lagging and leading indicators. Leading indicators attempt to predict future price movements, while lagging indicators provide information about the strength of an existing trend.
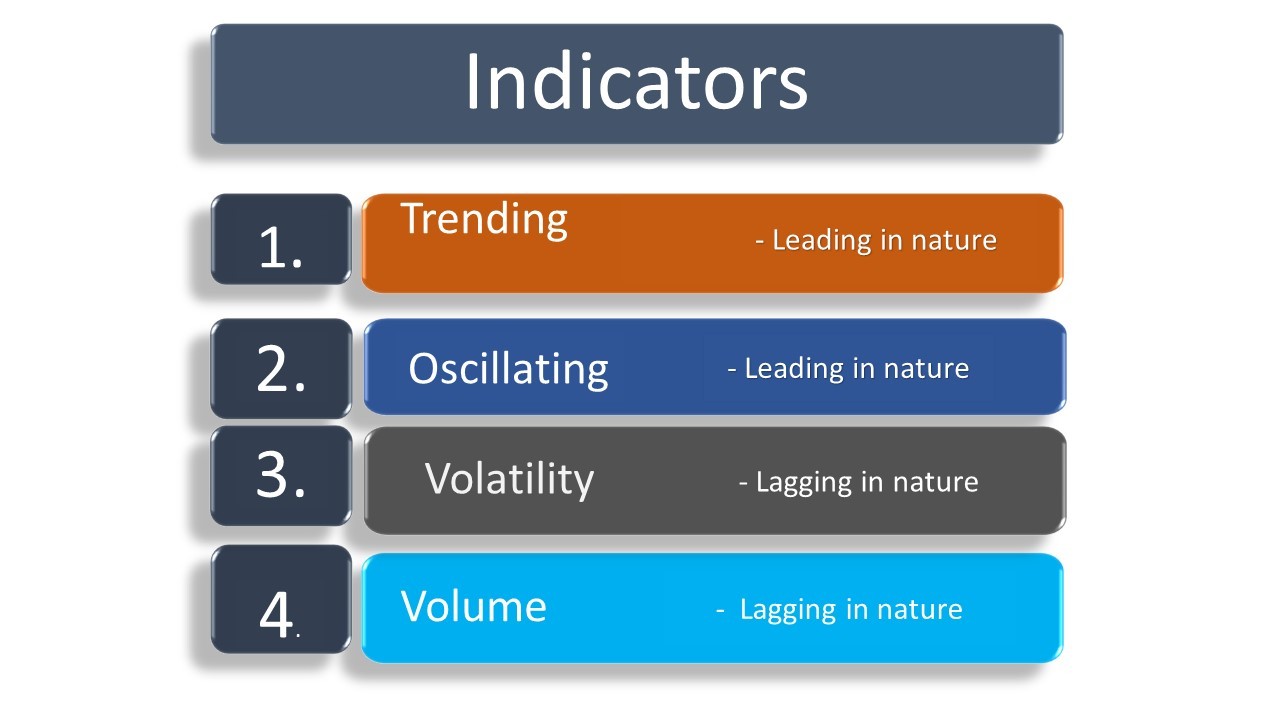
Based on their functions, there are four types of indicators:
a. Trend Indicators
b. Momentum Indicators
c. Volatility Indicators
d. Volume Indicators
Chart Analysis
Chart analysis is a method consisting of techniques used to analyze the market data of a financial security.
Basic techniques to analyze a stock, commodity, or currency chart include:
1. Trend analysis
2. Support & Resistance
3. Applying appropriate indicators
4. Multi-timeframe analysis (applying techniques across different time frames)
Powered by Froala Editor